Dynamic Process Benchmark DPB
Traditional factory management was like a black box. With tens of thousands of MES logging records piling up, review meetings relied largely on intuition to guess which station choked or which order lagged. Supervisors habitually pressured operators to speed up, completely missing the fact that up to 70% of delivery delays were caused by inter-process queuing and WIP stagnation.
With DPB, shop-floor reality becomes instantly transparent. Combining Lean value-stream principles with lightning-fast zero-server browser analytics, DPB cuts through massive shop-floor timestamps to isolate active processing from waiting waste. In under 3 minutes, managers can pinpoint bottleneck roots and take decisive action.
DPB 核心精神:鎖定異常工單 ➔ 精準拆解延遲原因
告別模糊平均,用數據抓住問題工單與停滯真相Delay Cause ①: Inter-process Queue Stagnation (73%)
The operators were not slow! Timestamp reconstruction revealed 5.8 hours of idle queue wait before Station [20-01 String Soldering] due to upstream traffic and scheduling gaps.
Delay Cause ②: Specific Station Variance (27%)
Net touch time exceeded standard benchmark, precisely pinpointed to prolonged setup on Lay-up Machine STR-04 and inexperienced operators.
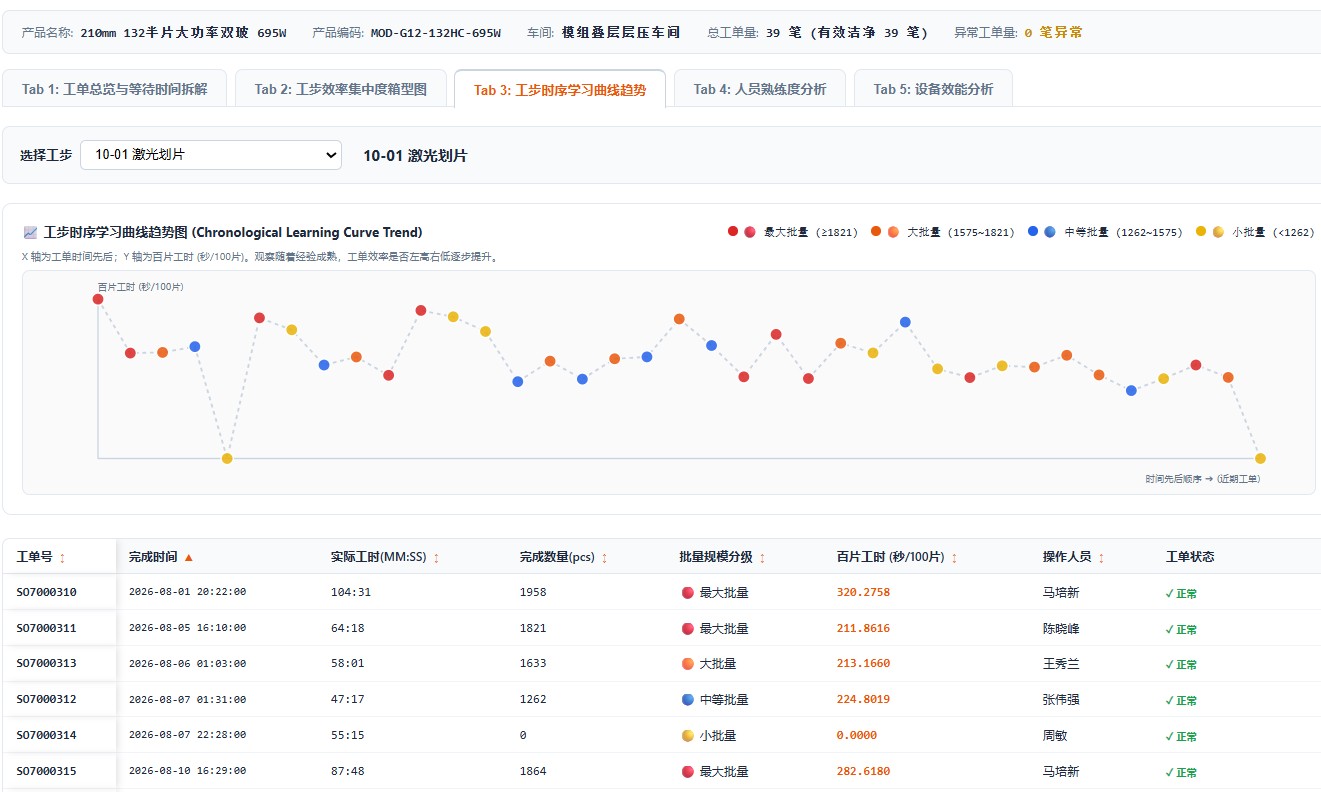
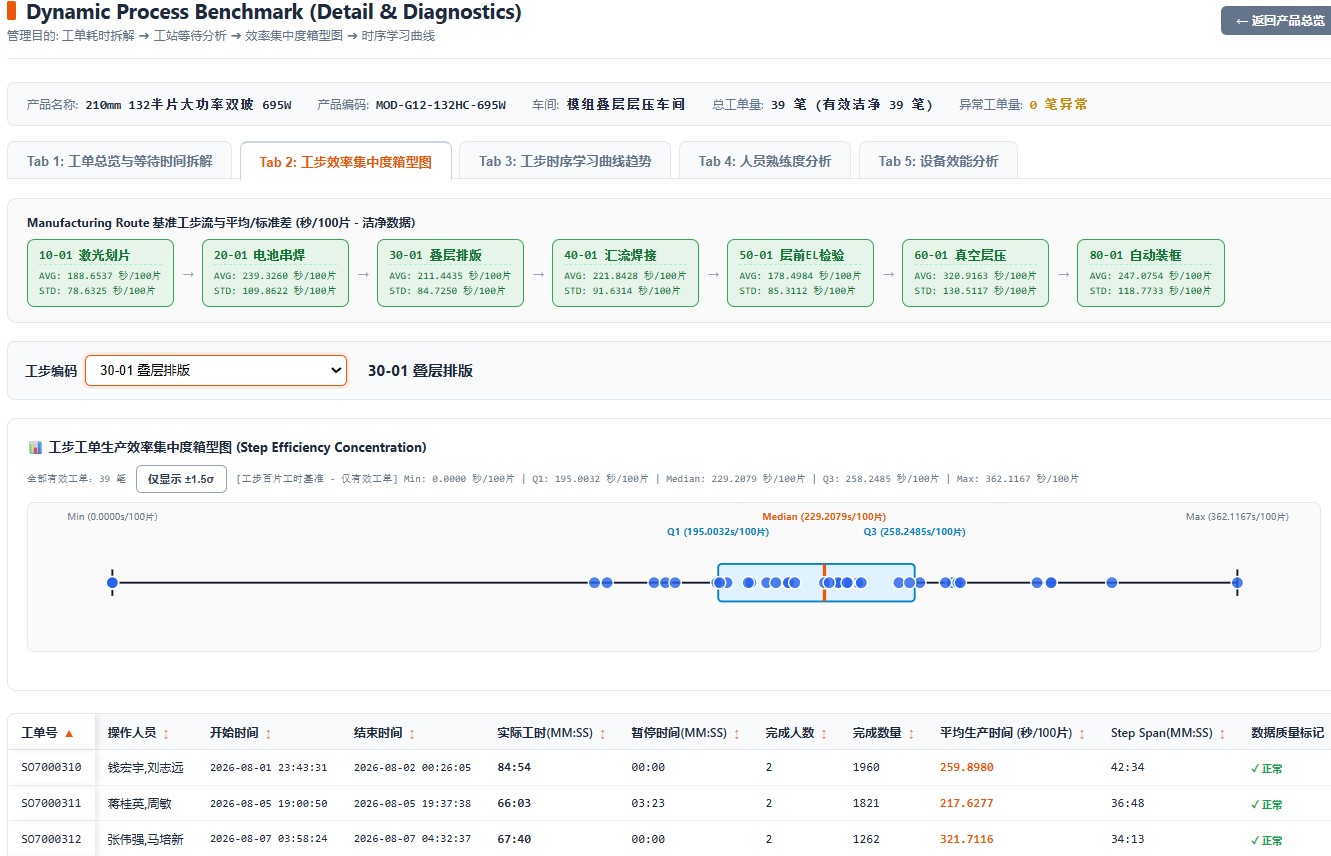
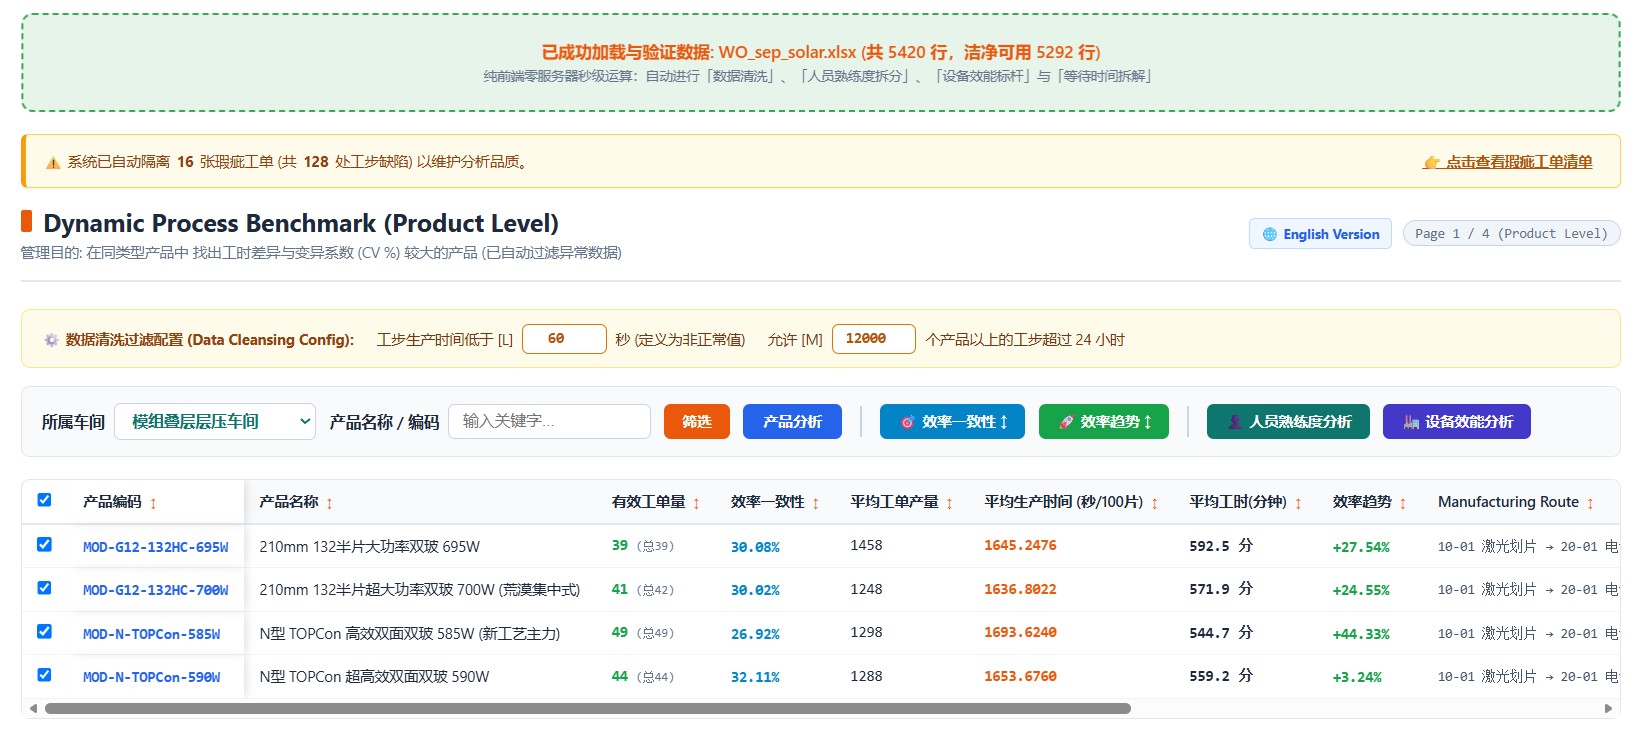
Multi-Dimensional Operational Dashboards
Hover cursor to expand and preview stacked dashboards