
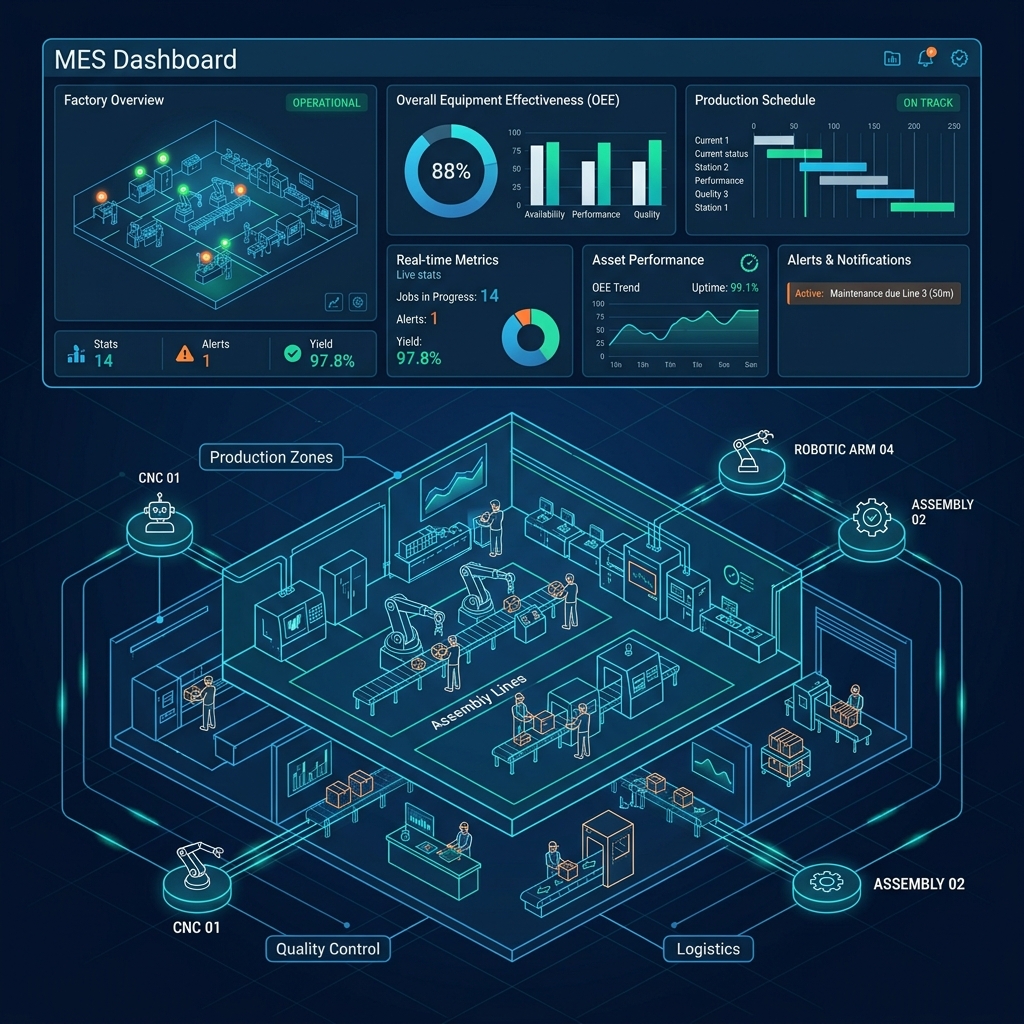
In today's wave of smart manufacturing and digital transformation, the Manufacturing Execution System (MES) has undoubtedly become a standard platform for major manufacturing enterprises. However, examining operational reality across many factories reveals a widespread yet tragic misconception: most organizations still treat MES merely as an automated data entry tool for the shop floor.
Companies invest millions in barcode scanning, automated dispatching, and material tracking, only for executives and floor managers to view MES as a "digital sign-in book" that replaces paper traveler sheets, clock-in cards, and daily shipping spreadsheets. If the positioning of MES stops here, it represents a massive waste of enterprise resources.
To thrive amid global market volatility and supply chain disruptions, enterprises must elevate the positioning of MES—evolving from a "production execution" tool into the core brain of "data-driven factory management." This is not merely a software upgrade, but a fundamental revolution in manufacturing management philosophy.
Beyond the "Digital Sign-in Book" Myth: Automated Clock-in Is Not Digital Management
Traditionally, MES deployment focused on resolving shop floor information opacity. Pain points like lost paper forms, delayed reporting, and manual error-prone data logs were significantly mitigated by Auto Data Collection (ADC) and barcode systems.
However, we must recognize a fundamental reality: automated data collection is merely the starting line of digitalization, never the finish line.
When a factory simply transfers paper forms onto digital screens, the resulting data remains static records dormant in databases. Managers reviewing yesterday's capacity reports every morning still engage in passive post-mortem reviews whenever yield drops or delivery dates slip. This "history recording" operational mode fails to alter the underlying management paradigm.
True Digitalization does not mean saving operators a few minutes of handwriting. It means analyzing massive collected data streams into actionable business intelligence that predicts anomalies, guides decision-making, and continuously optimizes operational ROI.
Four Strategic Paradigm Shifts in Factory Management
To transform MES into a genuine tool for data-driven factory management, executive leadership must drive four essential paradigm shifts across the organization:
Shift 1: From "Work Order Track & Trace" to "Real-Time Visibility, Output Prediction & Exception Guidance"
Legacy Execution Mindset (Track & Trace)
The system only answers "Which station is this Work Order currently at?". Production schedulers cannot predict completion dates and react passively when customer expedites occur.
Next-Gen Data Management (Predict & Guide)
The system combines historical process cycle times with dynamic WIP bottlenecks to continuously predict completion time (ETA), trigger automated Exception alerts upon delays, and provide Next-Action Guidance.
Under legacy operations, schedulers opening an MES screen only saw where a Work Order checked in. If upstream operations suffered equipment breakdown or setup delays, the impact was only discovered during end-of-shift reconciliations.
Next-gen data-driven MES possesses dynamic predictive capabilities: it continuously calculates estimated time of arrival (ETA) based on historical benchmark times and live Work-in-Progress (WIP) accumulation. When the system detects WIP dwell time exceeding safety thresholds at a specific step, it not only dispatches immediate Exception alerts to floor supervisors but also proactively provides Next-Action Guidance (e.g., "Recommend routing next 200pcs to Line B3 for parallel processing"). Management transforms from firefighting into proactive prevention and dynamic dispatching.
Shift 2: From "Defect Record Logging" to "Quality Intelligence & Statistical Root-Cause Variance Analysis"
Legacy Execution Mindset (Defect Logging)
QA personnel merely log defect counts and codes, printing monthly Pareto charts showing "scratch rate is highest" without discovering true root causes.
Next-Gen Data Management (Root-Cause Variance Analysis)
Via Quality Intelligence modules, the system automatically correlates defect occurrences with environmental shifts, equipment parameter drift, raw material batch variances, and operational recipe differences.
Quality issues rarely stem from a single variable. In traditional QA review meetings, production blames raw materials, procurement blames aging machinery, and maintenance blames operator error.
In a data-driven MES architecture, Quality Intelligence performs automated multi-variable correlation: "Analysis reveals 87% of defects this week concentrated on raw material Batch #0803 from Supplier C paired with Machine A4 operating above 185°C." By automatically isolating subtle production environmental variances, teams rely on statistical evidence rather than speculation to lock down root causes.
Shift 3: From "Mere Machine Status Monitoring" to "High-Utilization Bottlenecks & Failure Parameter Correlation"
Legacy Execution Mindset (Status Monitoring)
Dashboards only display running/idle/fault status lights. Managers know machines are "running" but cannot identify which high-demand machines are eroded by frequent micro-stoppages.
Next-Gen Data Management (Failure Parameter Correlation)
Analyzes high-utilization machines unable to increase throughput, automatically computing statistical correlation coefficients between Alarm logs and physical parameters (temperature, vibration, speed drift).
Equipment management often falls into the trap of "false green light comfort." Many machines display green running status on dashboards yet suffer over 30% capacity loss due to frequent micro-stoppages, recalibrations, and unexpected component faults.
Modern MES focuses on "high-utilization machines failing to deliver expected throughput" by cross-analyzing IIoT machine status signals (MACHINESTATUS) with Alarm logs (ALARM). The system automatically calculates statistical correlation coefficients between alarm occurrences and physical variables like temperature rise, vibration frequency, or oil pressure drops. Maintenance teams shift from reactive repair to predictive maintenance (PdM) at the earliest sign of parameter anomaly.
Shift 4: From "Reliance on Blacksmith Master Experience" to "Experience Digitization & Systemic Knowledge Base"
Legacy Execution Mindset (Implicit Tacit Knowledge)
Factories rely heavily on senior engineers' intuition and word-of-mouth experience. Personnel turnover causes severe technical gaps and quality instability.
Next-Gen Data Management (Tacit Knowledge Systematization)
Digitizes and models expert setup experience, parameter error-proofing rules, and dispatching logic into the MES brain, creating reusable enterprise assets.
The most fragile aspect of traditional manufacturing is storing critical operational knowledge inside senior technicians' heads. Unquantified experience leads to repeated errors by junior staff.
Digital transformation via MES aims for Tacit Knowledge Systematization. The system records and models expert tuning data during complex material runs or extreme ambient conditions. When identical conditions reoccur, MES outputs optimal parameter guidance, allowing new operators to achieve over 80% of expert efficiency from day one.
Data Value Chain Architecture: MES DIKD Model
Why can MES achieve these four strategic paradigm shifts? The fundamental enabler is the complete Data Value Chain architecture:
Data
Work Orders, Barcodes, IIoT Signals
Information
Step Flows, Unit Touch Time, Batch Binding
Knowledge
CV Coefficient, Variance Matrix, Route Benchmark
Decision
Bottleneck Dispatching, Accurate Quoting, Dynamic Routing
Improvement
TCO Reduction, Productivity Gains, Continuous Lean
As shown above, MES automatically structures raw shop-floor Data into contextualized Information tied to Work Orders and Batches; algorithms then cross-analyze multi-dimensional metrics into actionable Knowledge; ultimately empowering executive management with precision Decision capability.
Case Study 1: Dynamic Process Benchmark (DPB)
To illustrate how data-driven management operates in practice, consider the Dynamic Process Benchmark (DPB) module deployed in advanced smart factories.
Traditional MES only records total Work Order start and end timestamps. When IE engineers attempt labor standardization or investigate slowdowns, granular evidence is missing. DPB elevates shop-floor management to a new dimension:
1. Exact Unit Touch Time (UTT) Computation
DPB eliminates crude gross time metrics, factoring out pause durations and weighting operator headcounts to accurately calculate net touch seconds per unit across every process step Route:
2. Coefficient of Variation (CV Lead Time) for Stability Benchmarking
Standard deviation fails across products with different time baselines. DPB uses the Coefficient of Variation ($\text{CV} = \text{StdDev} / \text{Mean} \times 100\%$) to enable direct stability comparison across diverse product lines, automatically flagging high-CV steps.
3. Four-Tier Quantile Batch Scale & Chronological Box Plots
DPB automatically classifies historical Work Orders into quantile batch tiers:
- 🔴 Red (Q3 Large Batch Scale): Efficiency baseline under mass production.
- 🟠 Orange (Q2 Medium-Large Batch) & 🔵 Blue (Q1 Medium-Small Batch).
- 🟡 Yellow (Q1 Small Batch Scale): Setup time and changeover overhead losses.
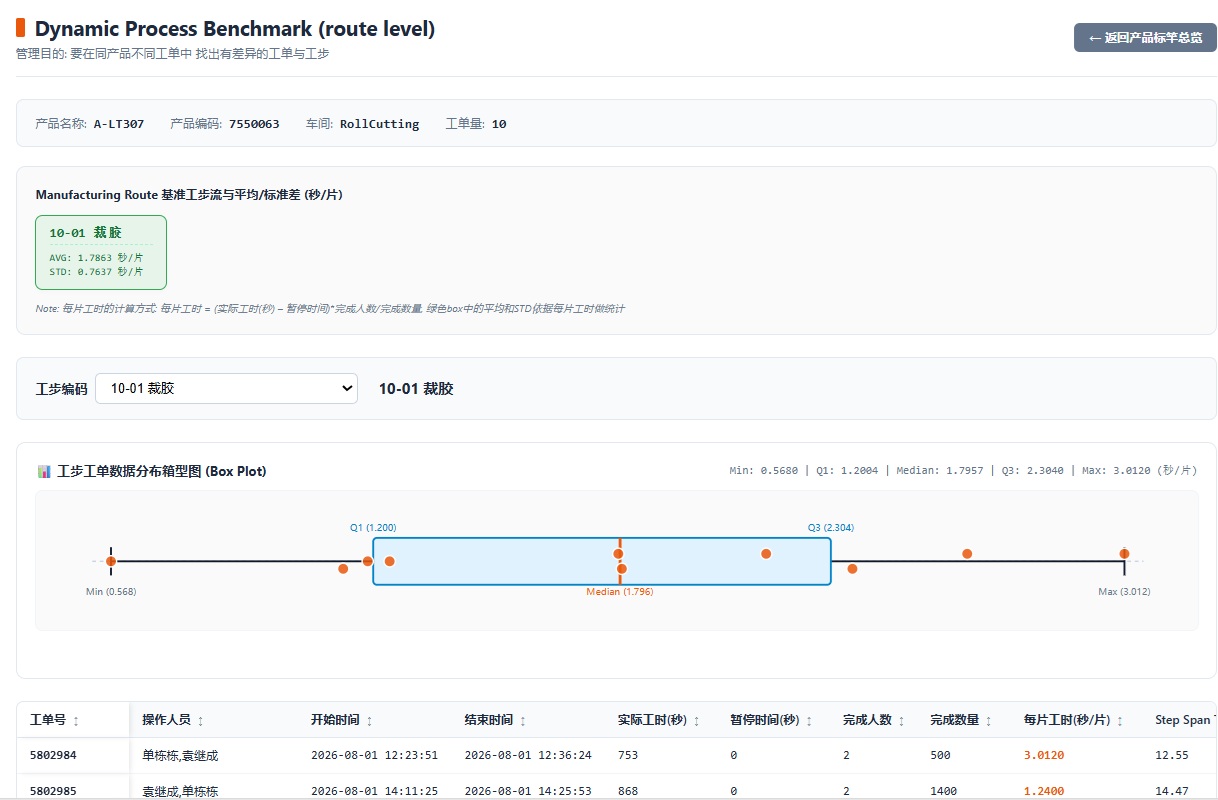
▲ Figure 1: DPB Dynamic Process Benchmark System displaying Route Green Flow Chain and Chronological Scatter/Box Plot Canvas
As shown in Figure 1, selecting any product code displays its full manufacturing step sequence (e.g., `10-01 Stamping → 20-01 Scraping → 30-01 Packaging`) along with chronological scatter plots and SVG IQR box plots.
What decision capability does this grant management?
Instead of IE engineers spending weeks on shop floors with stopwatches, MES analyzes historical data in the background, telling managers: "Step 20-01 exhibits maximum variance, and small batch UTT is 2.4x higher than large batches!" Schedulers optimize batch grouping immediately, while sales teams gain precise cost estimation models.
Case Study 2: OEE Bottleneck Mining & Failure Parameter Correlation
Our second case study demonstrates how MES transforms equipment management from static status light monitoring into failure parameter correlation mining.
In traditional factories, managers look at OEE dashboards featuring green running bars and grey idle bars. Executives know certain expensive machines are heavily utilized, but cannot answer: "Why is an ultra-high utilization machine failing to deliver higher throughput? Which alarms cause the heaviest capacity losses?".
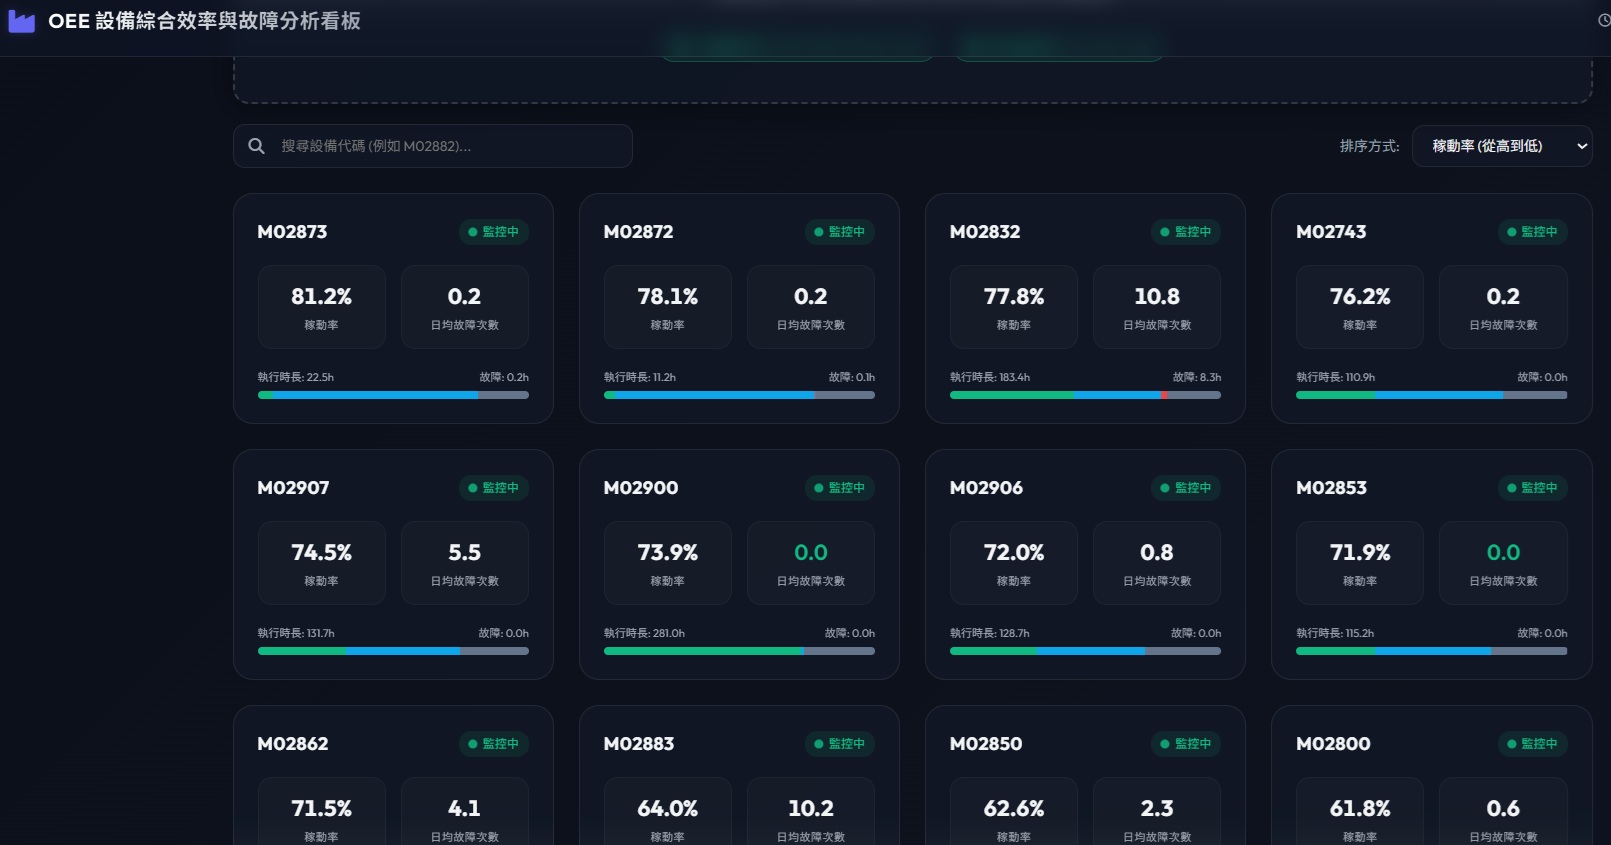
▲ Figure 2: OEE Shop-Floor Machine Status Overview (Combining Real-Time Status Gantt Timelines, OEE Pillars, and Status Filters)
As shown in Figure 2, next-gen MES provides an intuitive Status Gantt Timeline and Live KPI Cards. Managers gain instant visibility across Running, Waiting, and Fault states, quickly filtering out high-risk bottleneck machines with high utilization (>85%) but OEE dragged down by downtime.
Furthermore, upon selecting a bottleneck machine, the system executes its Fault & Parameter Correlation Engine:
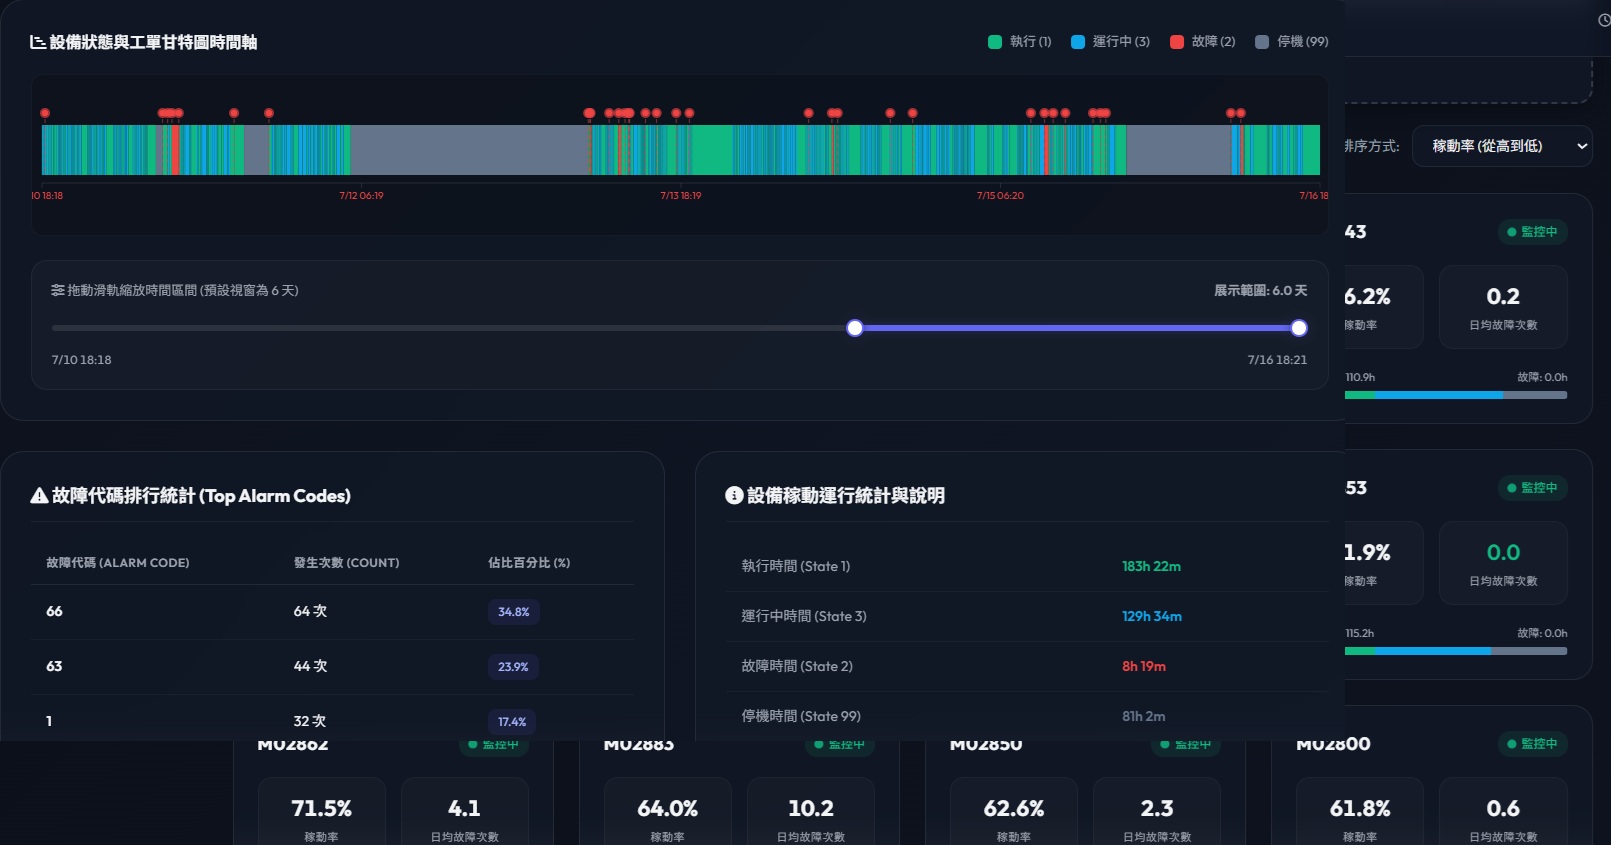
▲ Figure 3: Equipment Alarm Frequency Distribution and Physical Parameter Correlation Canvas
As illustrated in Figure 3, MES correlates IIoT machine status signals (MACHINESTATUS) with Alarm logs (ALARM 3), delivering key breakthroughs:
- Alarm Frequency & Duration Quantization: Cross-analyzes pause frequencies against cumulative downtime, ranking top capacity-killing Alarm Codes (e.g., #32 Bearing Overheat).
- Parameter Correlation Matrix ($r$): Analyzes physical parameters 30 minutes prior to alarm triggers, establishing statistical correlations: "Bearing overheat alarms show strong positive correlation ($r = 0.84$) with spindle speed drift and negative correlation ($r = -0.79$) with lube oil pressure drops."
| Comparison Dimension | Legacy Execution MES (Status Monitoring) | Data-Driven Management MES (Failure Correlation) |
|---|---|---|
| Equipment Scope | Monitors single machine "running or idle" status | Focuses on bottleneck machines with high utilization eroded by faults |
| Failure Analysis | Manual post-mortem downtime logging & repair tickets | IIoT signals automatically align ALARM logs with duration rankings |
| Parameter Correlation | No visibility into parameter-failure relationships | Calculates statistical correlation coefficients ($r$) between alarms and physical variables |
| Maintenance Strategy | Reactive repair after catastrophic failure (Firefighting) | Sets alert thresholds on strongly correlated parameters for Predictive Maintenance (PdM) |
Ultimate Value to Maintenance Engineering:
Engineers no longer replace parts blindly, nor do they ignore hidden bottlenecks simply because a light shows green. Maintenance teams set proactive alert thresholds on strongly correlated physical parameters, scheduling maintenance before breakdowns occur to maximize actual throughput.
Conclusion: The Platform Philosophy for Data-Driven Factories
The essence of manufacturing digital transformation is not purchasing expensive software or cluttering the shop floor with screens. The core value of digitalization lies in whether data transforms management decision quality and response speed.
MES must transcend the narrow positioning of a "digital paper replacement." By building a highly integrated database architecture, object-oriented logical flexibility, and data-mining modules like Predictive Progress 推演, Quality Intelligence, DPB Dynamic Benchmarks, and OEE Failure Correlation, MES becomes the true brain of data-driven factory management.
When every byte of shop-floor data translates into precision operational decisions, manufacturing enterprises achieve continuous lean growth and sustainable competitive agility.